

Data processing becomes critical when training a robust machine learning model. We occasionally need to restructure and add new data to the datasets to increase the efficiency of the data.
We’ll look at how to combine multiple datasets and merge multiple datasets with the same and different column names in this article. We’ll use the pandas library’s following functions to carry out these operations.
pandas.concat()pandas.merge()pandas.DataFrame.join()
Preparing Sample Data
We’ll create sample datasets using pandas.DataFrame() function and then perform concatenating operations on them.
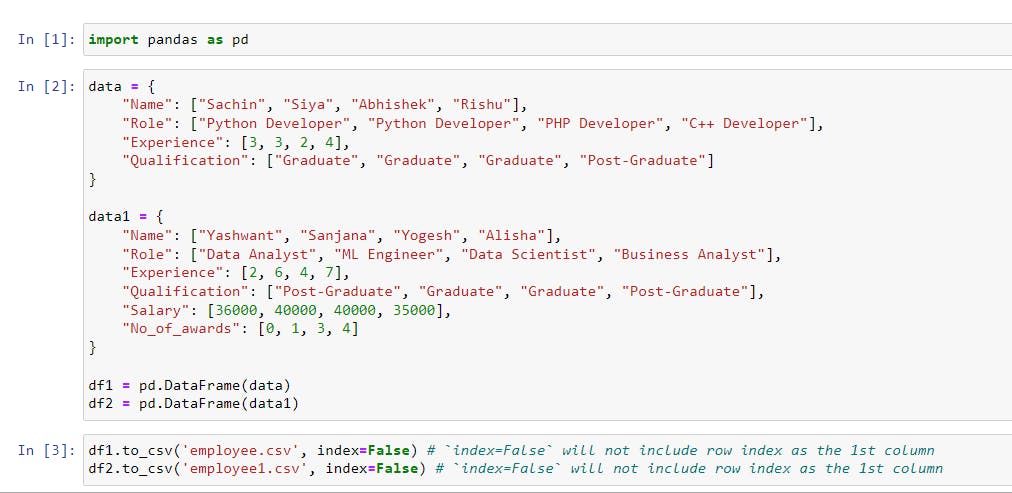
The code in the image will generate two datasets from data and data1 using pd.DataFrame(data) and pd.DataFrame(data1) and store them in the variables df1 and df2.
Then, using the .to_csv() function, df1 and df2 will be saved in the CSV format as 'employee.csv' and 'employee1.csv' respectively.
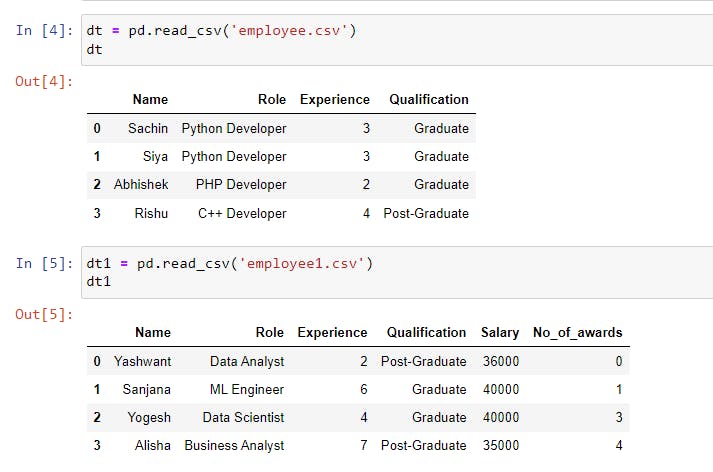
Here, the data that we created looks as shown in the following image.
Combining Data Using concat()
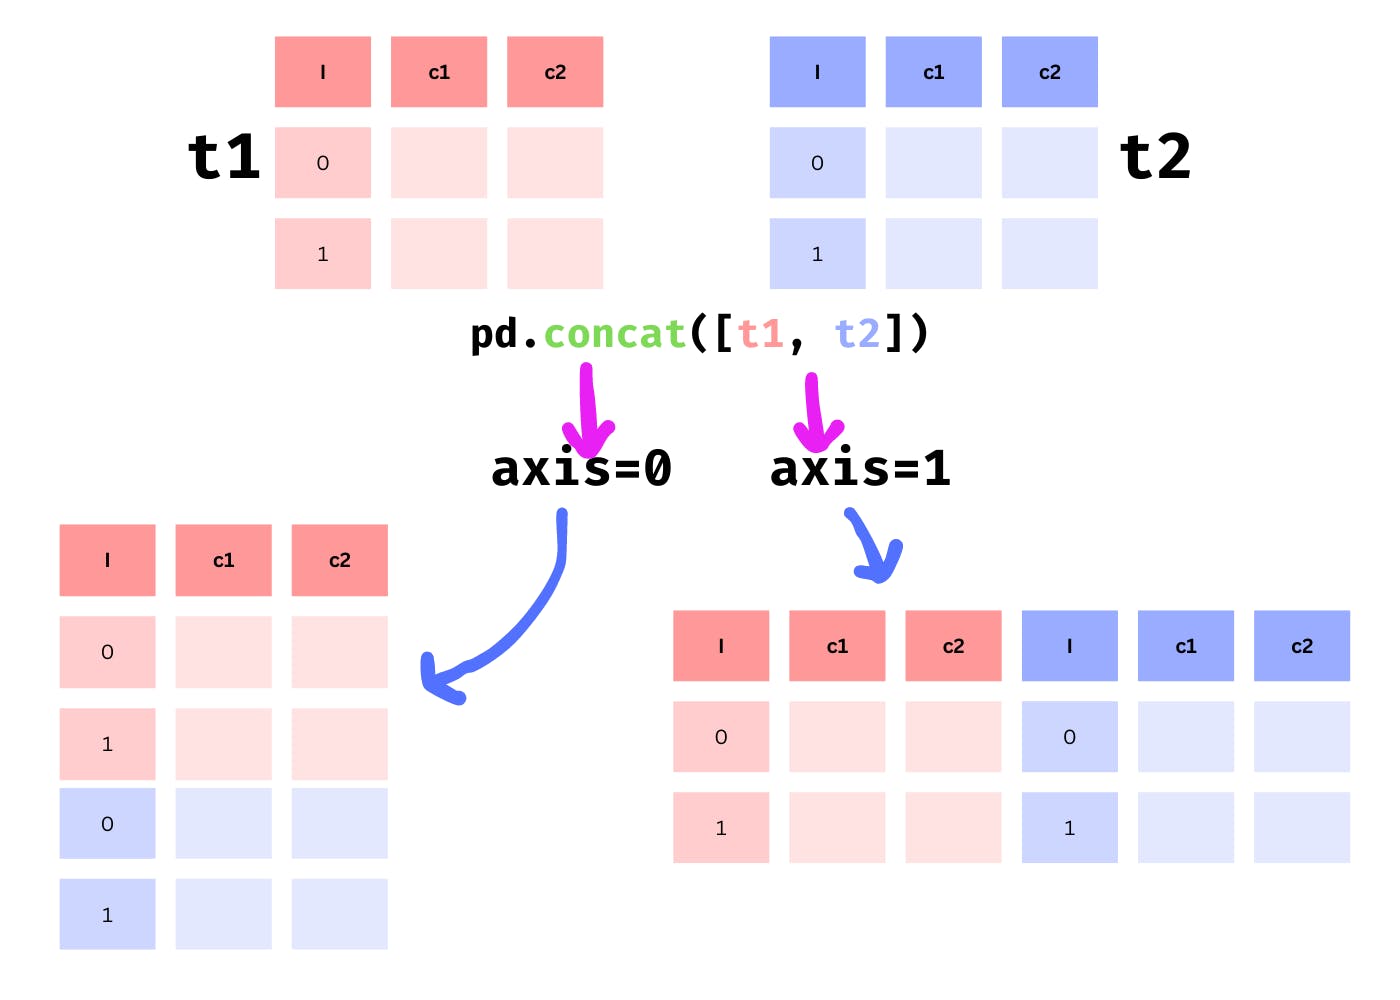
We can use the pandas library to analyze, modify, and do other things with our CSV (comma-separated value) data. The library includes the concat() function which we will use to perform the concatenation of multiple datasets.
There are two axes on which the datasets can be concatenated: the row axis and the column axis.
Combine Data Along the Row Axis
We previously created two datasets named 'employee.csv' and 'employee1.csv'. We’ll concatenate them horizontally, which means the data will be spliced across the rows.
|
1 |
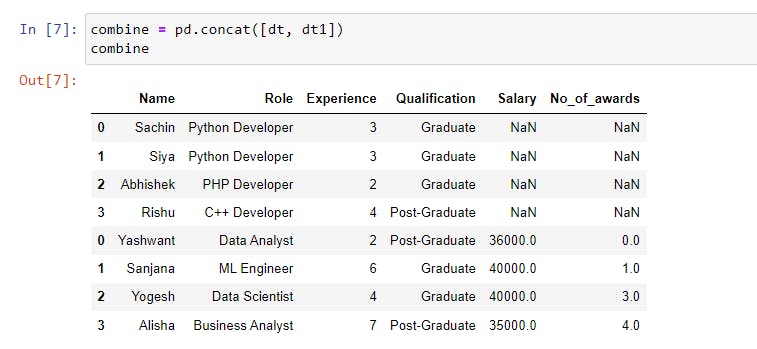
combine = pd.concat([dt, dt1]) |
The above code demonstrates the basic use of the concat() function. We passed a list of datasets(objects) that will be combined along the row axis by default.
The concat() function accepts some parameters that affect the concatenation of the data.
The indices of the data are taken from their corresponding data, as seen in the above output. How do we create a new data index?
The ignore_index Parameter
When ignore_index=True is set, a new index from 0 to n-1 is created. The default value is False, which is why the indices were repeated in the above example.
|
1 |
set_index = pd.concat([dt, dt1], ignore_index=True) |
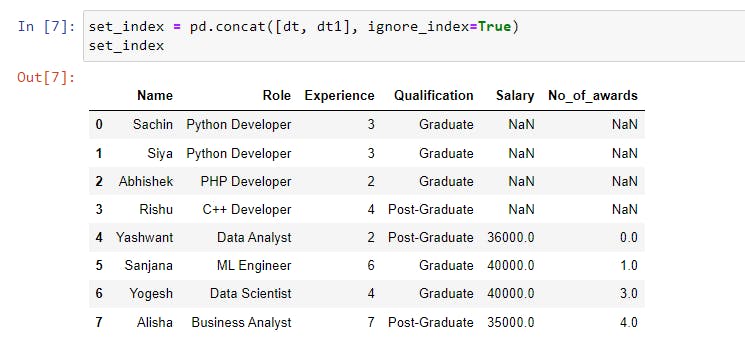
As shown in the image above, the dataset contains a new index ranging from 0 to 7.
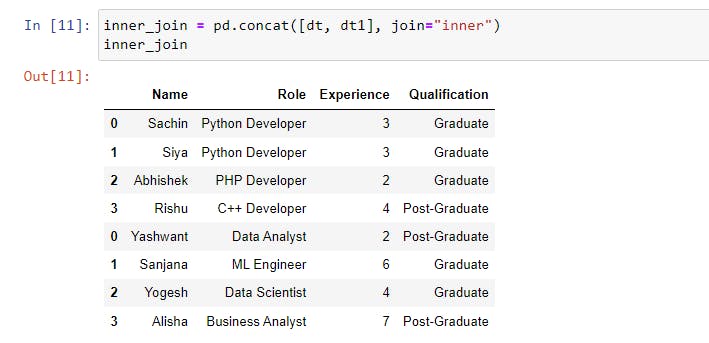
The join Parameter
In the above image, we can see that the first four data points for the Salary and No_of_awards columns are missing.
This is due to the join parameter, which by default is set to "outer" which joins the data exactly as it is. If it is set to "inner", data that does not match another dataset is removed.
|
1 |
inner_join = pd.concat([dt, dt1], join="inner") |
The keys Parameter
The keys parameter creates an index from the keys which is used to differentiate and identify the original data in the concatenated objects.
|
1 |
keys = pd.concat([dt, dt1], keys=["Dataset1", "Dataset2"]) |
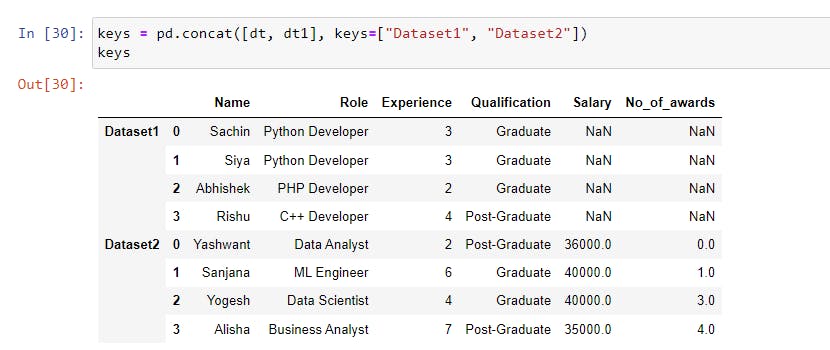
The datasets were concatenated, and a multi-level index was created, with the first level representing the outermost index (Dataset1 and Dataset2 from the keys) and the second level representing the original index.
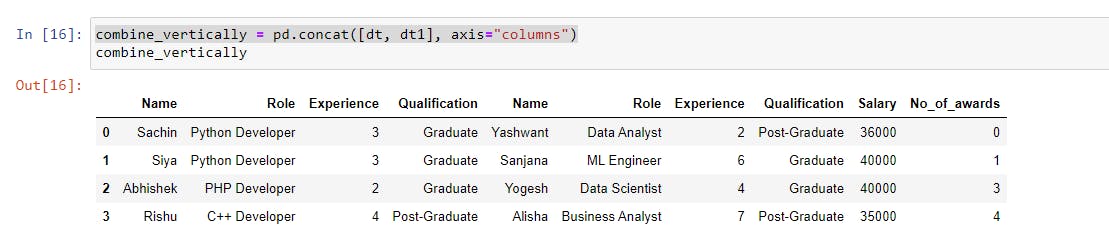
Combine Data Along the Column Axis
The datasets were concatenated along the row axis or horizontally in the previous section, but in this approach, we will stitch them vertically or along the column axis using the axis parameter.
The axis parameter is set to 0 or "index" by default, which concatenates the datasets along the row axis, but if we change its value to 1 or "columns", it concatenates the datasets along the column axis.
|
1 2 3 |
combine_vertically = pd.concat([dt, dt1], axis="columns") #---------------------------OR---------------------------# combine_vertically = pd.concat([dt, dt1], axis=1) |
Merging Data Using merge()
The pandas.merge() function merges data from one or more datasets based on common columns or indices.
We’ll operate on a different dataset that we created and contains the information shown in the following image.
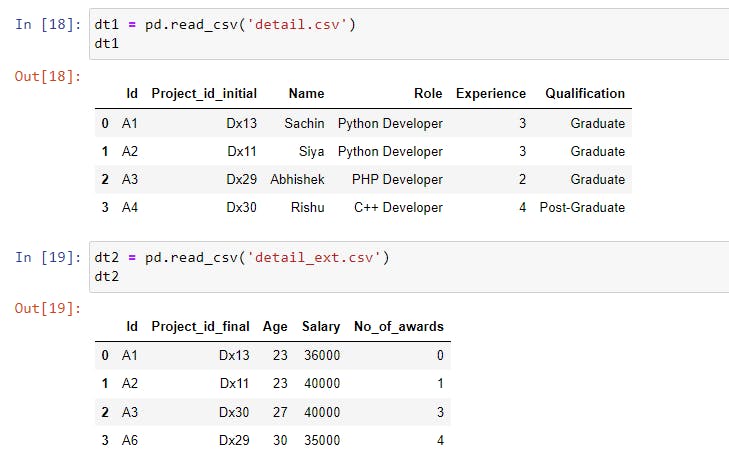
The merge() function takes left and right parameters which are datasets to be merged.
The how Parameter
We can now specify the type of merge we want to perform on these datasets by providing the how parameter. The how parameter allows for five different types of merges:
inner: Default. It only includes the values that match from both datasets.outer: It includes all of the values from both datasets but fills the missing values withNaN(Not a Number).left: It includes all of the values from the left dataset and replaces any missing values in the right dataset withNaN.right: It includes all of the values from the right dataset and replaces any missing values in the left dataset withNaN.cross: It creates the Cartesian product which means that the number of rows created will be equal to the product of the row counts of both datasets. If both datasets have four rows, then four times four (4 * 4) equals sixteen (16) rows.
Examples
Performing inner merge
|
1 |
inner_merging = pd.merge(dt1, dt2, how="inner") |
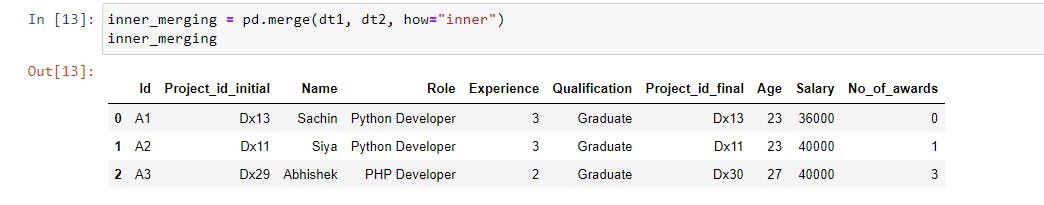
We can see that only values with the same Id from both datasets have been included.
Performing outer merge
|
1 |
outer_merging = pd.merge(dt1, dt2, how="outer") |
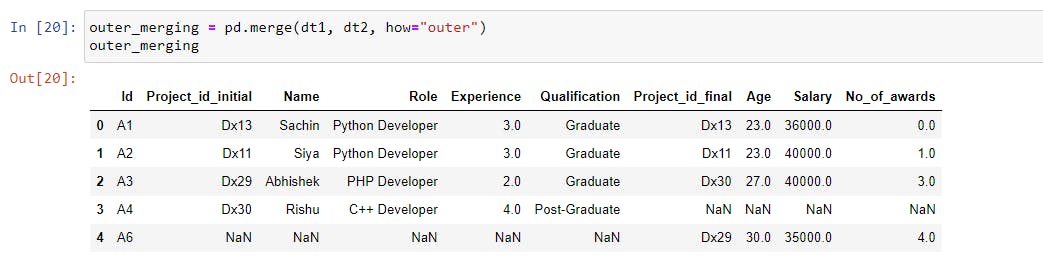
In the case of an outer merge, all of the values from both datasets were included, and the missing fields were filled in with NaN.
Performing left merge
|
1 |
left_merging = pd.merge(dt1, dt2, how="left") |
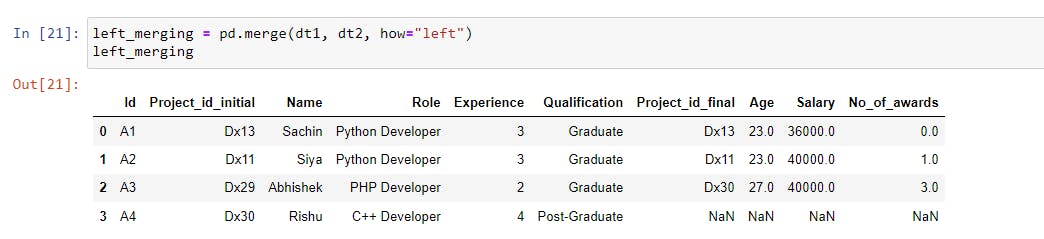
The matching values of the right dataset (dt2) were merged in the left dataset (dt1) and the values of the last four columns (Project_id_final, Age, Salary, and No_of_awards) were not found for A4, so they were filled in with NaN.
Performing right merge
|
1 |
right_merging = pd.merge(dt1, dt2, how="right") |
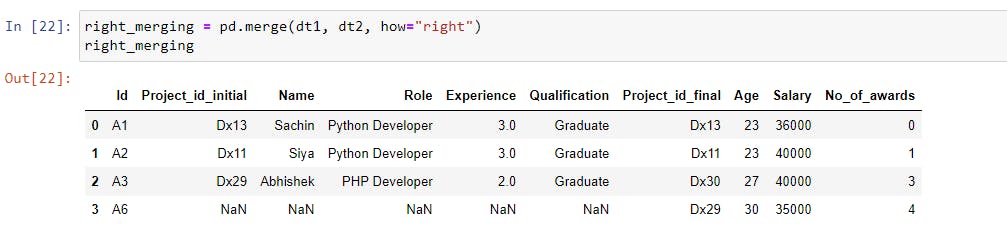
The matching values of the left dataset (dt1) were merged in the right dataset (dt2) and the values of the first five columns (Project_id_initial, Name, Role, Experience, and Qualification) were not found for A6, so they were filled in with NaN.
Cross Merging the Datasets
The how parameter has five different types of merge, one of which is a cross merge.
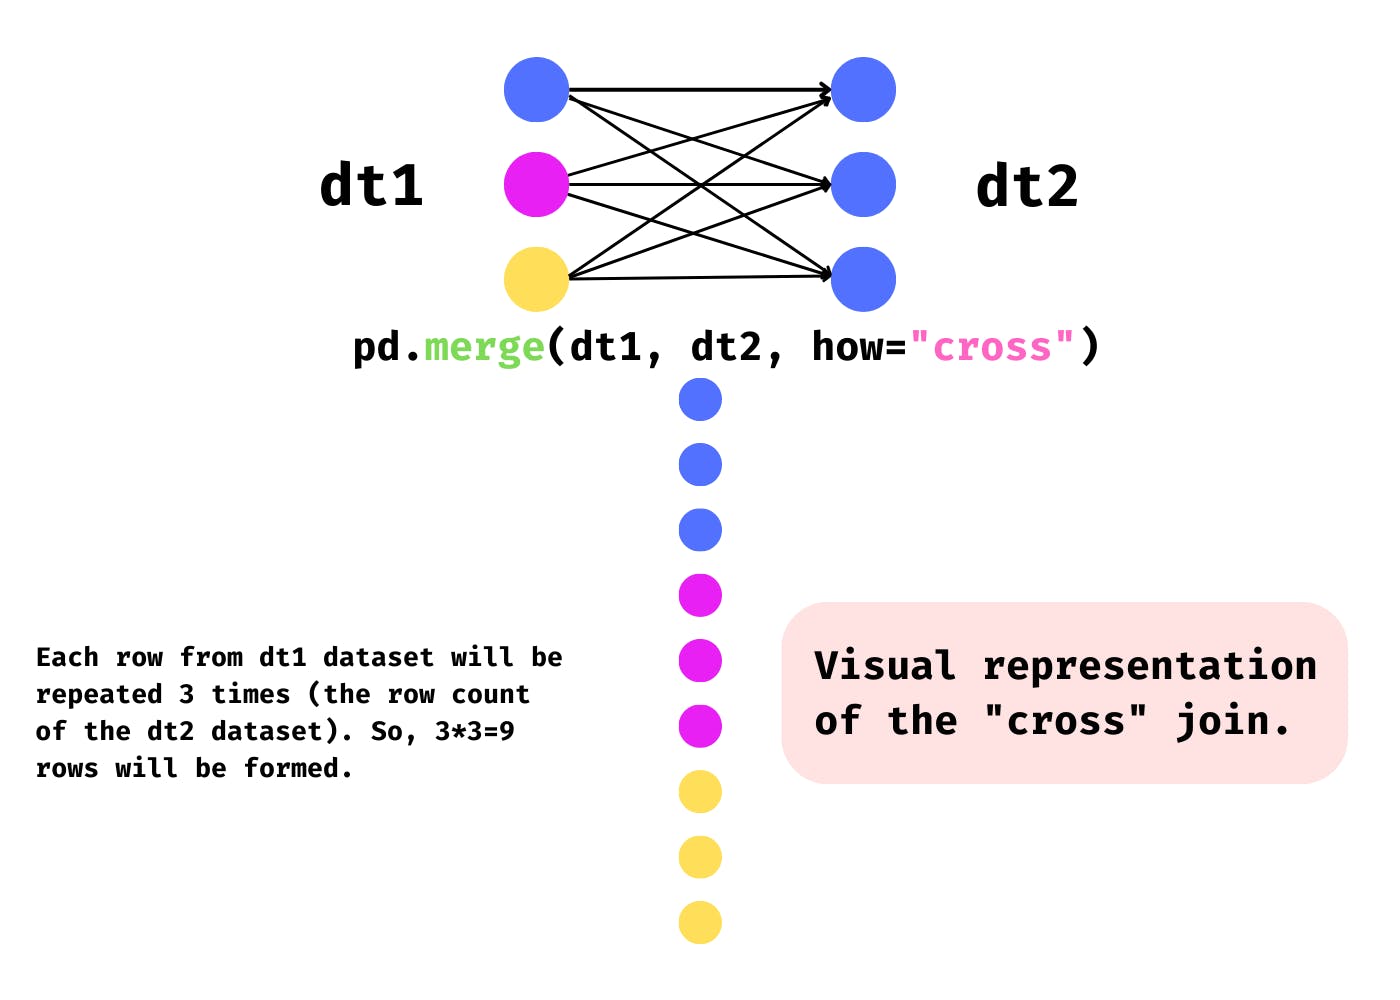
As previously stated, it generates the Cartesian product, with the number of rows formed equal to the product of row counts from both datasets. Take a look at the illustration below to get a better understanding.
|
1 |
cross_merging = pd.merge(dt1, dt2, how="cross") |
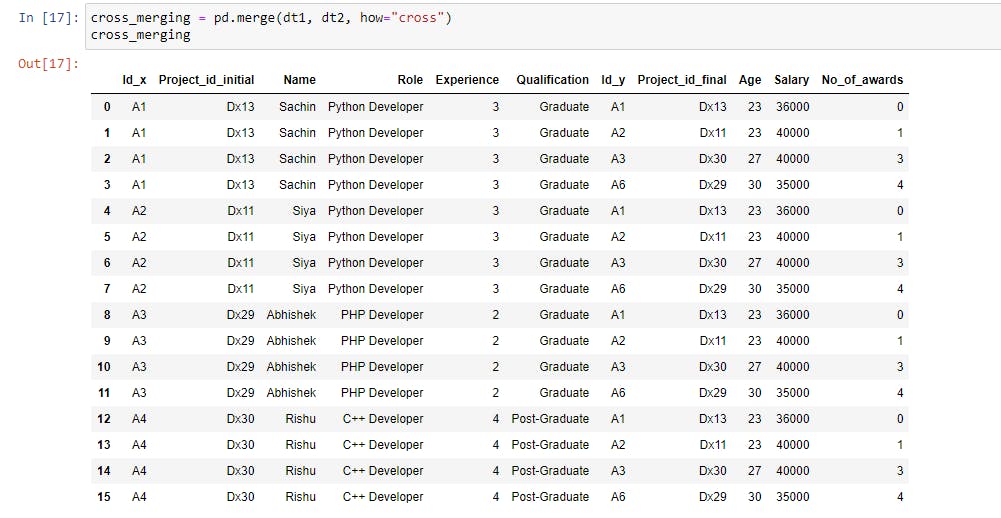
Both datasets have four rows each, and each row from dt1 is repeated four times (row count of dt2), resulting in a data set of sixteen rows.
The on, left_on & right_on Parameters
The on parameter accepts the name of a column or index(row) to join on. It could be a single name or a list of names.
The left_on and right_on parameter takes a column or index(row) name from the left and right dataset to join on. They are used when both datasets have different column names to join on.
Merging Datasets on the Same Column
To merge the datasets based on the same column, we can use the on parameter and pass the common column name that both datasets must have.
|
1 |
merging_on_same_column = pd.merge(dt1, dt2, on='Id') |
We are merging datasets dt1 and dt2 based on the 'Id' column that they both share.
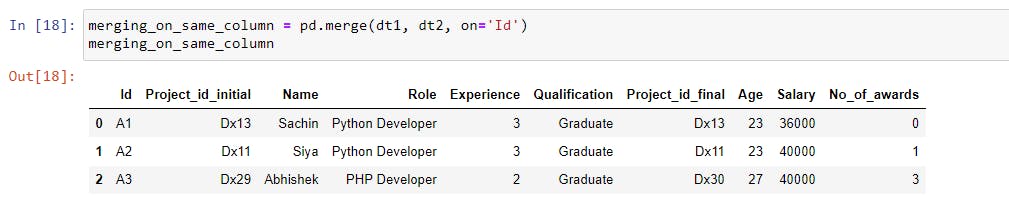
The matching Id column values from both datasets were merged, and the non-matching values were removed.
Merging Datasets on Different Columns
To merge different columns in the left and right datasets, use the left_on and right_on parameters.
|
1 |
left_right_merging = pd.merge(dt1, dt2, left_on="Project_id_initial", right_on='Project_id_final') |
The joining column is the "Project_id_initial" column from the left dataset (dt1) and the "Project_id_final" column from the right dataset (dt2). The values shared by both columns will be used to merge them.
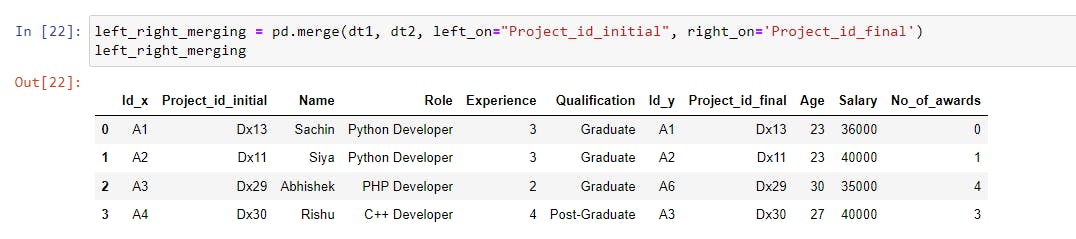
As we can see, the dataset includes both columns, as well as matching rows based on the common values in both the "Project_id_initial" and "Project_id_final" columns.
Changing the Suffix of the Column
If you notice that the merged dataset has two Id columns labeled Id_x and Id_y, this is due to the suffixes parameter, which has default values _x and _y, and when overlapping column names are found in the left and right datasets, they are suffixed with default values.
|
1 |
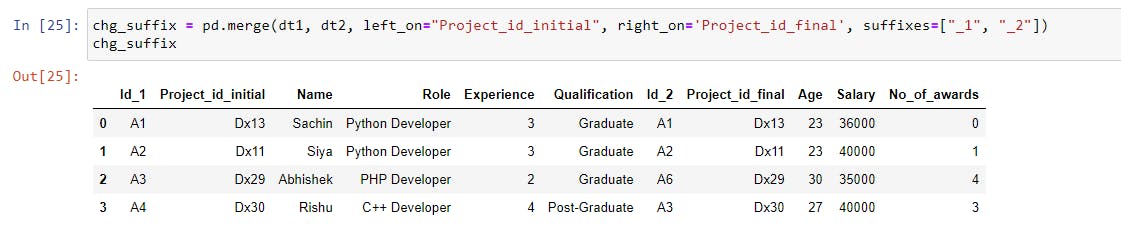
chg_suffix = pd.merge(dt1, dt2, suffixes=["_1", "_2"], left_on="Project_id_initial", right_on='Project_id_final') |
This will append the suffixes "_1" and "_2" to the overlapping columns. Because both datasets have the same column name Id, the Id column will appear to be Id_1 in the left dataset and Id_2 in the right dataset.
Joining Datasets Using join()
The join() method works on the DataFrame object and joins the columns based on the index values. Let’s perform a basic join operation on the dataset.
|
1 |
dt1.join(dt2, lsuffix="_1", rsuffix="_2") |
The columns of the dt2 dataset will be joined with the dt1 dataset based on the index values.
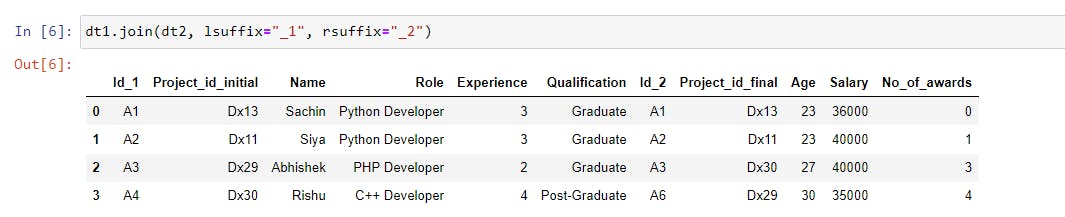
Since the index values of both datasets are the same which is 0, 1, 2, and 3, that’s why we got all the rows.
The join() method’s parameters can be used to manipulate the dataset. The join() method, like the merge() function, includes how and on parameters.
how: Default value isleftjoin. It is the same as thehowparameter of themerge()function, but the difference is that it performs index-based joins.on: A column or index name is required to join on the index in the specified dataset.lsuffixandrsuffix: Used to append the suffix to the left and right datasets’ overlapping columns.
Examples
Left join on an index
|
1 2 3 |
dt1.join(dt2.set_index("Id"), on="Id", how="left") #-------------------------OR----------------------# dt1.join(dt2.set_index("Id"), on="Id") |
In the above code, we use set_index('Id') to set the Id column of the dt2 dataset as the index and perform a left join (how="left") on the Id column (on="Id") between dt1 and dt2.
This will join matching values in the Id column of the dt2 dataset with the Id column of the dt1 dataset. If any values are missing, they will be filled in by NaN.
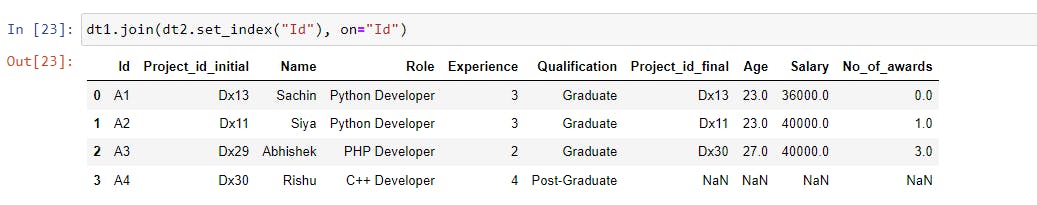
It’s the same as when we used the merge() function, but this time we’re joining based on the index.
Right join on an index
|
1 |
dt1.join(dt2.set_index("Id"), on="Id", how="right") |
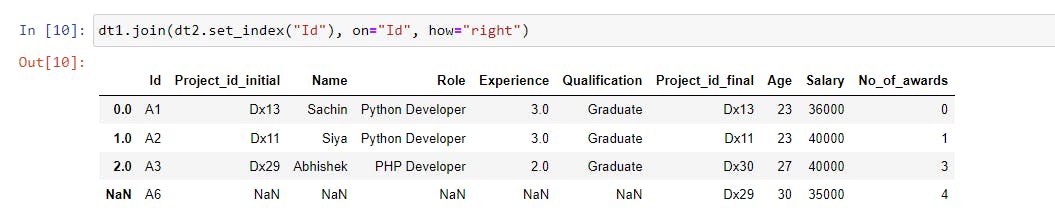
We are joining the dt1 dataset with the index of the dt2 dataset based on the Id column. We got NaN in the first five columns for A6 because there were no values specified in the dt1 dataset.
Inner join on an index
|
1 |
dt1.join(dt2.set_index("Id"), on="Id", how="inner") |
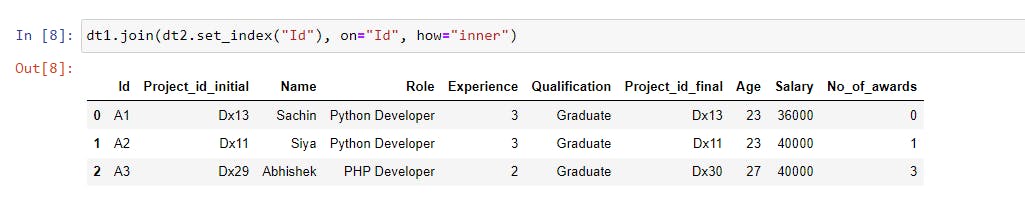
The datasets were joined based on matching index values, i.e., both datasets dt1 and dt2 share A1, A2, and A3, so the values corresponding to these indices were joined.
Outer join on an index
|
1 |
dt1.join(dt2.set_index("Id"), on="Id", how="outer") |
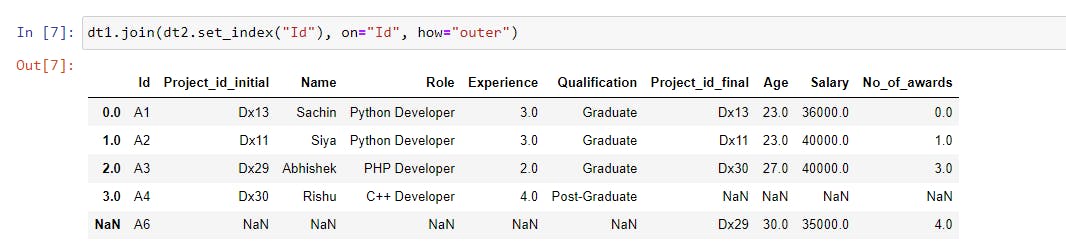
We performed the outer join, which included all of the rows from both datasets based on the Id. The corresponding values have been filled in, and missing values have been filled in with NaN.
Cross Join
|
1 |
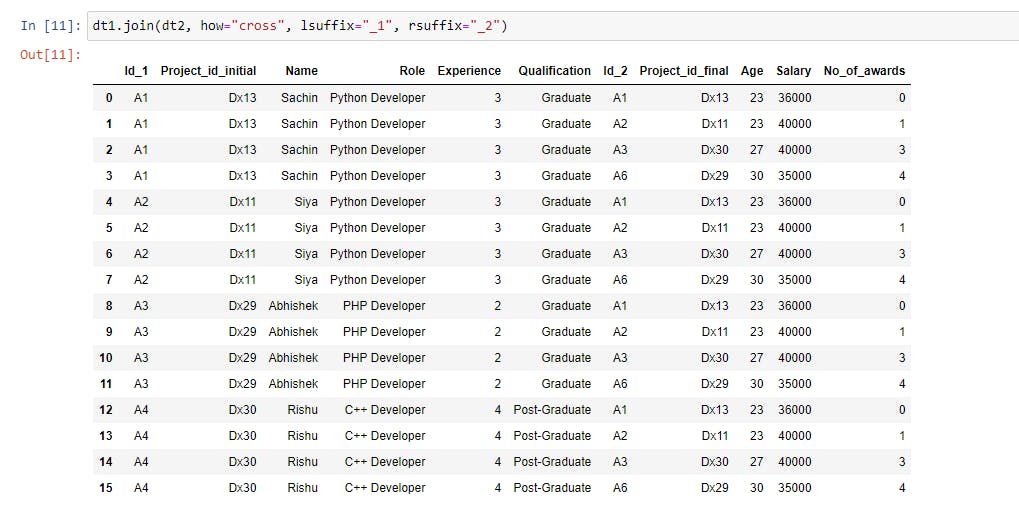
dt1.join(dt2, how="cross", lsuffix="_1", rsuffix="_2") |
We didn’t pass the on parameter, instead, we defined how the data should join (how="cross"). The resulting dataset will be the product of both datasets’ row counts.
Conclusion
We’ve learned how to use pandas.concat(), pandas.merge(), and pandas.DataFrame.join() to combine, merge, and join DataFrames.
The concat() function in pandas is a go-to option for combining the DataFrames due to its simplicity. However, if we want more control over how the data is joined and on which column in the DataFrame, the merge() function is a good choice. If we want to join data based on the index, we should use the join() method.
🏆Other articles you might be interested in if you liked this one
✅How to use assert statements for debugging in Python?
✅How to write unit tests using the unittest module in Python?
✅What are the uses of asterisk(*) in Python?
✅What are the init and new methods in Python?
✅How to build a custom deep learning model using Python?
✅How to generate temporary files and directories using tempfile in Python?
✅How to run the Flask app from the terminal?
That’s all for now
Keep coding✌✌


